Issues in the Flash Translation Layer for Storage Arrays

Much of the current technical discussion surrounding the Flash Translation Layer (FTL) centers around two subjects.

  1. The relative merits of CPU-based FTL vs. SSD Controller based FTL for the PCIe attached flash products. The market leader in this space advocates the former while more current designs take the latter approach.
  2. The continuous algorithmic improvements of the FTL within SSD controllers to minimize write latency and amplification.

There is much work to be done on both fronts with the advent of Triple Level Cell (TLC) flash and the accompanying limitations.

Storage system designers face a different class of issues when many SSD devices are grouped in an enterprise array. The interaction of application, kernel and driver behavior with some features of the FTL in SSD controllers can be detrimental to performance and longevity. An enterprise storage system must consider the FTL as a composite abstraction covering software and hardware behavior within the array’s processing complex as well as the individual SSD devices used for persistent media.

In a thinly provisioned storage system, slabs of address space from the physical disks (or stripes of the physical disks) are doled out on demand. Traditional models would suggest trying to balance this allocation among all SSD devices based on aggregate write history. This may not be correct from a performance standpoint. Writing 100GB to an SSD device as a single 100GB sequential write versus overwriting the same 20GB address space 5 times is not equivalent. The same amount of physical writing to the flash devices has occurred but the latter case will leave the media with significantly more available blocks for future writing. Performance-based optimization can expect slabs allocated from this second case to see better write performance. Ideally, write performance of each SSD device should be tracked to “reverse engineer” the amount of performance lost due to previously written data (consuming spare blocks, incurring write amplification, etc.).

It is commonly believed that write amplification can be avoided by relying on sequential writing, such as a log-based structure. Experimental data shows this not to be the case, even when the application is using uniform block size writes. This can occur because both the operating system and HBA device driver may aggregate sequential writes causing actual writes to be integer multiples of the basic block size. When the same address space is overwritten sequentially without alignment of the actual physical writes, write amplification can occur. Enforcing the application’s block size and alignment may require OS tuning and firmware settings on the HBA when supported by the vendor.

As smaller lithographies and triple level technology enters the market, additional performance issues arise. Today, SSD manufacturers can warranty the life of the drive (sometimes by write throttling) based on the statistical model of flash cell life and overprovisioned space. However, current ECC schemes used in MLC are not as statistically relevant from a performance view. The write and read performance of today’s MLC drive is largely the same during the first year and last year of service as the overhead and statistical probability of corrections is relatively low. This can change dramatically with the wide ECC schemes proposed for TLC flash. Both the probability of hitting errors and the computational requirements for correcting these errors rises dramatically, resulting in constantly degrading performance over the lifetime. Error correction can be designed to deliver deterministic lifetime of TLC flash based on the physics and write cycles, but cannot simultaneously deliver consistent performance over that life.

These issues will be explored in more detail in future postings.

TCO Comparison of Flash-Powered Cloud Architectures vs. Traditional Approaches

Recently, GridIron and Brocade announced a new joint Reference Architecture for large scale cloud-enabled clustered applications that delivers record performance and energy savings.  While the specific configuration that was validated by Demartek was for Clustered MySQL Applications, the architecture and the benefits apply equally to other cluster configurations such as Oracle RAC and Hadoop.  The announcement is available here: GridIron Systems and Brocade Set New 1 Million IOPS Standard for Cloud-based Application Performance and Demartek’s evaluation report is available online at: GridIron & Brocade 1 Million IOPS Performance Evalution Report.

Let us take a closer look at the Total Cost of Ownership (TCO) profile of the Reference Architecture vis-à-vis  alternatives.  For the OpEx component, we’ll just use power consumption as the main/only metric.

Requirements:

  • Total IOPS needed from the cluster = 1 Million Read IOPS and 500,000 Write IOPS
  • Total capacity of the aggregate database = 50 TB

Assumptions:

  • Cost of a server with the requisite amount of memory, network adapters, 4x HDDs RAIDed, etc. = $3,000
  • Number of Read/Write IOPS out of a server with internal/local disks = 500
  • Power consumption per average server = 500 Watts
  • It takes a watt to cool a watt; in other words if a server consumes 500 Watts, it takes another 500 Watts to cool that server
  • Cost of Power: USA commercial pricing average of $0.107/KWH
  • The cost of the many Ethernet switch ports vs. the few Fibre Channel switch ports is assumed to be equivalent and will be excluded from the calculations.

Option 1: Traditional Implementation Using Physical Servers

In this scenario, IOPS is more of a determining factor for the number of servers required rather than the capacity of the total database.

  • Number of servers (with spinning HDDs) required to hit 1 Million IOPS = 1,000
  • Assuming 40 servers per rack, total number of Racks = 1,000/40 = 25 Racks
  • Cost of the server infrastructure = 1,000 * 3,000 = $3,000,000
  • Power consumed by the serves = 500 * 1,000 = 500 kW
  • Power required for cooling = 500 kW
  • Total power consumption = 1000 kW
  • Annual OpEx based on power consumption = $0.107 * 1000 * 24 * 365 = $937,320
Option 2: Traditional Implementation Using Physical Servers AND PCIe Flash Cards in Each of the Servers
In this scenario, capacity of the total database (limited by the flash capacity of the PCIe flash cards) is more of a determining factor for the number of servers required rather than the IOPS from each server.
  • Capacity of each PCIe flash card = 300 GB
  • Two PCIe cards will be used to RAID/mirror per server
  • Number of servers required to get to 50TB total = 167
  • Assuming 40 servers per rack, total number of racks required = 5 Racks
  • Cost of the server infrastructure = 167 * 3,000 = $501,000
  • Cost of the PCIe flash cards ($17/GB) = 2 * 167 * 300 * 17 = $1,703,400
  • Total cost of server infrastructure including flash = $2,204,400
  • Power consumed by the servers = 500 * 167 = 83 kW
  • Power required for cooling = 83 kW
  • Total power consumption = 166 kW
  • Annual OpEx based on power consumption = $0.107 * 166 * 24 * 365 = $155,595

Option 3: Implementation Using GridIron-Brocade Reference Architecture

Two GridIron OneAppliance FlashCubes will be used for a mirrored HA configuration.  Each FlashCube has 50TB of Flash.

  • Number of servers required = 20
  • Rack Units of the two FlashCubes = 2 * 5 = 10 RU
  • Total number of Racks = 1 Rack
  • Cost of the server infrastructure = 20 * 3,000 = $60,000
  • Cost of the FlashCubes = 2 * 300,000 = $600,000
  • Total cost of the server infrastructure including flash = $660,000
  • Power consumption per FlashCube = 1,100W
  • Power consumed by the servers and FlashCube = 20 * 500 + 2 * 1,100 = 12.2 kW
  • Power required for cooling = 12.2 kW
  • Total power consumption = 24.4 kW
  • Annual OpEx based on power consumption = $0.107 * 24.4 * 24 * 365 = $22,871
Comparison Summary of Different Approaches
Traditional Traditional with PCIe Flash GridIron-Brocade Reference Architecture
Number of servers 1,000 167 20
Number of Racks 25 5 1
CapEx of Infrastructure $3,000,000 $2,204,000 $660,000
Power Consumption (kW) 1,000 166 24
OpEx* (just based on power) $937,320 $155,595 $22,871
*The difference in the management costs of 1,000 servers vs. 20 servers will be equally dramatic, but is not included in the calculations above.

Normalized Comparison of Different Approaches

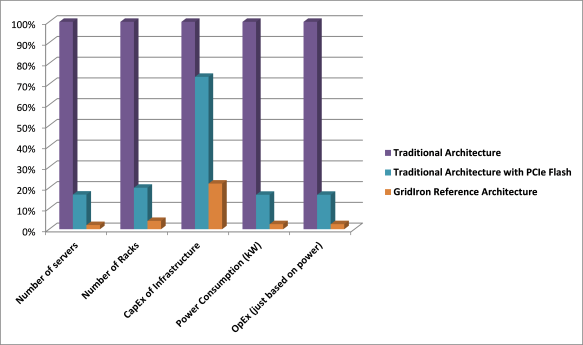
By normalizing the values in the comparison table (where the values of the traditional approach is at 100% and the other values are relative to 100%), we get the following graph.  It is very clear from the graph that both the CapEx and OpEx are dramatically lower with the GridIron-Brocade Reference Architecture.

Normalized Comparison of Different Approaches to Building Large Clusters

Normalized Comparison of Different Approaches

The Bandwidth Imbalance between Server Memory and Server PCIe Flash

Is flash in the server better suited as:

  1. memory addition or
  2. fast local disk?

While there is excitement in the industry about using PCIe flash as memory, here are some facts to consider:

  • The memory system of a Xeon CPU runs at 10 Million+ IOPS with latencies around 0.1 uS and pushing 30+ GBytes/sec
  • A typical PCI-e flash card performs at 100,000+ random IOPS with latencies around 100uS and pushing 1.5GB/sec

As you can see, adding a flash card to server memory means you are actually REDUCING the speed of memory in the server.  Additionally, Operating Systems don’t know how to deal with a NUMA architecture that’s non-uniform by

  1. 1:10 in access performance
  2. READ/WRITE asymmetry of 1:10 to 1:1000

Sandy Bridge class servers are ratcheting up server I/O demands further making the bandwidth imbalance between server memory and server flash even more drastic.

So faced with the choice of a) adding flash to server memory to slow it down and confuse the OS, or b) adding flash as a very fast local store, the obvious choice is (b)!

This blog post is a summary of a post in the Flash Tech Talk blog.  Read the full original post here: https://talkingflash.wordpress.com/2012/04/20/will-you-feed-me-when-im-64/

Hot Rods are Cool Again for Big Data

Back in the 1930’s and lasting well into the 1950’s an innovative and brave group of tinkerers took it upon themselves to take stock roadsters and modify their engines in an unchecked passion of good old American ingenuity all in the name of speed.  High compression heads, overhead-cam conversion and radical cams became part of the hot rod lexicon.  Going faster was fun, and if you could get the fastest car, you’d get the social benefits of being popular.  But taking technology risks to make something better is what set the real innovators apart from the rest of the crowd.   Many of these innovations actually made it into the mainstream and became common practice production cars.

I can’t help but see a parallel universe emerging for Big Data.  You have this existing infrastructure of database applications, servers, fabrics and storage that you need to “tune-up” for the fastest execution time.  You need to “hot rod” your data.  And THAT was the inspiration for our product, how can you take a data roadster and turn it into a data hot rod?!!  IT innovators who can transform their legacy infrastructure to do MORE with their data are the next breed of innovators.  But how do you go to your custom shop and find the right parts, or tool your own in your machine shop.  That’s where we come in.

The GridIron TurboCharger is just that, the magic tuning ingredient you need to create your own data hot rod.  To make sure you recognize its ability in your IT environment, we actually did paint it racing orange and added the flames.  It really stands out, not only visually but working as a vital component in creating your data hot rod.

What are the hot rod problems we solve, the equivalent of high compression heads, cam-conversions and the like?  First we address the toughest problem in front of IT today, where do I put my flash?!!  Flash can go in so many places it makes your head spin, and the more places you put it, the harder it is to manage it.  Fusion IO is telling you to put it in your server, your storage array companies are saying to add it to their already overtaxed storage arrays and use tiering software to figure out your hot data and migrate it there.  We say something much simpler, put SSD at the heart of your engine, between the server and storage and offload BOTH.  Let us figure out your hot data in real time and place it in SSD available immediately to speed up your applications.

Customers who have deployed our appliances have seen their applications run times and reporting times on their data sets improve anywhere from 2x to 10x.  How much is it worth to YOUR business if you can drive THAT much faster?!!  I’m betting it is worth a lot.  But we’re not charging a fortune for this technology to make it easier for you to see the real benefits and to make your infrastructure a data hot rod.  And as a side benefit if you want to see how your app is tuned up, we have a graphical engine in our GridIron Management System (GMS) that lets you plot all kinds of data to see what benefit you are getting from front end to back end.  You might learn a lot more about your application than you ever thought you could.

So come to our shop, get a TurboCharger installed in your data engine.  If you don’t believe us, we’ll even let you test drive one.  But trust me, if you see what our customers see, you won’t be putting it back in its box.  Join our growing roster of customers and Put the Pedal to the Metal!!!


Herb Schneider
VP of Engineering and TurboCharger Enthusiast

Concurrent Bandwidth – The Elephant in The Room Flash Array Vendors Wish You’d Ignore

IOPS. IOPS. IOPS.

It’s the bragging right of the flash SSD world. And vendors go to obsessive lengths to talk about it. Check out the wiki page for IOPS. Note at the bottom of the page and in the edit history of the page how the SSD makers are falling over each other to make sure that the world knows about how many IO operations per second their products can do.

And they report it differently. Let’s review.

Chip Makers

Micron, Hitachi, SanDisk and a few other companies actually make the NAND chips. Easy for them and not so debatable – a chip clearly says it can do so many reads/sec and so many writes/sec. Fun starts when people add their software magic to make SSDs.

SSD appliance makers sometimes quantify the IOPS rating of the controller while other times they simply add up the IOPS rating of the SSDs. But there are some impressive claims.

However, the moment you use SSDs in a shared appliance, what matters most is concurrent bandwidth, not just the raw IOPS. It does not really matter whether you call the offering an enterprise flash array or a SAN/NAS flash storage appliance or a flash memory array – a shared environment requires a LOT more concurrent bandwidth than a dedicated server attached pipe.

A Simple Metric

So, we have SSD appliances in the market with ratings of hundreds of thousands of IOPS. But what about concurrency?

Storage controller designers traditionally did not have to worry about too many concurrent hosts. After all, if all you have is a storage media capable of few hundreds or low thousands of IOPS then what’s the point of sharing them with multiple servers.

On the other hand the raison d’être of SSD appliances are huge amount of IOPS – and attached to a network – they beg to be shared.

A single multi-core server can push bursts of 50,000 IOPS. A blade-center or a pretty pedestrian collection of four servers or a mid-range server (such as a Dell R710) can easily put out burst loads of 200,000 IOPS. And on a SAN or NAS – they are not exactly 512-byte mouselings. Consider these:

  1. Normal file-system buffer size – 4K Bytes – @ 200,000 that is  0.8 GB/sec per server.  For four mid-range servers that is 3.2 GB/sec.
  2. What if it is not just file system work but you have MySQL running on web-layer – default 8K Bytes – now we’re at 6.4GB/sec with 4 servers @ 200K IOPS each.
  3. Vendors eagerly push their SSD appliances for databases. Oracle with table-scans (data warehouse, DSS) will have default block size of 32K Bytes or higher. We’re talking 25GB/sec bursts.
You think a server can not push 6GB/sec of IO in that last example? An Intel Sandy Bridge server IO slot is PCI-gen3x8. Four 16G FC ports  can push that IO easily and the memory bus has enough bandwidth to absorb it.
A shared SAN SSD appliance sees a very different kind of load mix than a PCI-e SSD card or a PCI-e direct-attached dedicated appliance. There is a reason there are NO TPC-H database benchmarks with SAN SSD appliances (as of March 2012). Go ahead. Check it out. There are several benchmarks floating around for direct-attached PCI-e SSD or PCI-e SSD appliances doing well on transaction processing applications. That’s single use – small IO. They hardly get more civilized than that.
Here are the performance specs of the three SAN SSD appliances.
Spec downloaded from respective vendor’s website as of March 28, 2012.
Please let us know if you find any errors or discrepancies and we’ll make every effort to correct them promptly.

The last column is the Cross-section bandwidth of Storage and it is a simple metric obtained by dividing the bandwidth of the connectivity of the storage to the total capacity of the storage. The connectivity bandwidth is either the bandwidth of the network connections or the bandwidth of the flash attachment network – whichever one is the dominant part.

Compare these numbers with another SSD appliance metric:

The guys from the lone-star state make a great product with a proud history and happy users. It’s built like the proverbial brick outhouse and their hardware specs are top-notch.

They were #2 in IOPS/TB and #1 in cross-section bandwidth in this comparison.

The Violin specs are a tie with #1 in IOPS/TB and #2 in cross-section bandwidth. It’s got plenty of network connectivity (8x 8G Fibre Channel) but the MLC array is specified at a lower 2GB/sec. It’s a well balanced design and boasts of some very nitty-gritty details built ground up with loving care.

The rearguard of these three is Pure Storage and the numbers look alarmingly low initially until you look at the foundation technology of this particular vendor. The somewhat low numbers are a direct artifact of using de-dupe/compression to meet you capacity goals.

Coming soon – Server vs. Array Flash – a Suitability Analysis…

Warp Speed Big Data – 1 Million IOPS using MLC

For anyone who ever doubted that MLC could deliver high performance – welcome to a new frontier! Here at GridIron, we have boldly gone where no company has gone before by being the first company to use MLC to drive one million IOPS. This is good news for us, obviously, but it is also good news for all those IT folks out there who are struggling to balance the performance challenges of Big Data and databases with efficiency and cost savings.

When we look at simple economics, it is clear that MLC, not SLC or eMLC, is the direction in which high volume Flash technology is headed. Already we see the falling price of MLC bringing it into alignment with the price of hard disk. That’s why we here at GridIron think it makes perfect sense to boldly direct engineering resources to developing Big Data solutions that incorporate MLC.

To ensure we are not delusional, we invited some independent third parties in to take a look at what we have accomplished. They have helped us confirm that we have indeed made MLC history. You’ll hear more about the specifics in upcoming posts.

We have repeatedly verified that we can run systems with production database loads at one MILLION IOPS (LOVE that number). Users can expect server consolidation of at least 10:1 and reduce power consumption by a staggering 60%. We are excited about what this performance breakthrough means for MLC technology and for the value it will bring to Big Data.

Warp speed for Big Data is here!

MLC Flash for Big Data Acceleration

Big data analysis demands bandwidth and concurrent access to stored data. Write load will depend on data ingest rates and batch processing demands. The data involved will typically be new data and updates of existing data. Indices and other metadata may be recalculated, but is generally not done in real time. The economics of supporting such workloads focus on the ability to cost effectively provide bulk access for concurrent streams. If only a single stream is being processed, spinning disk is fine. However, providing highly concurrent access to the dataset requires either a widely-striped caching solution or a clustered architecture with local disk (Hadoop). Because write lifetimes for flash are not stressed in this environment, utilizing wide stripes of MLC for caching is the most cost-effective way to provide highly concurrent access to the dataset in a shared-storage environment.

Now, a lot of the SLC versus MLC debate centers on blocking and write performance – specifically dealing with write latency and the blocking impact on reads. With traditional storage layout, data can be striped over only a few disks (4 data disks for stripes of RAID 5/6). This creates high read blocking probability for even the smallest write loads. By distributing the data over very wide non-RAID stripes (up to 40 disks wide), the affect of variable write latency can be mitigated by dynamically selecting least-read disks for new cache data and greatly reducing the impact of writes on the general read load. The wider the striping of physical disks in a caching media the greater the support for concurrent access and mixed read and write loads from the application. MLC is an excellent media choice, both technically and economically.

By employing affordable MLC as a write-through caching layer that is consistent with the backend storage, the effect of even multiple simultaneous flash SSD failures can be removed. Most traditional storage systems cannot survive multiple concurrent drive failures and suffer significant performance degradation when recovering (rebuilding) from a single device failure. Cache systems can continue operation in the face of cache media failures by simply fetching missing data from the storage system and redistributing to other caching media. However, it’s important to note that placing the cache in front of the storage controller is critical to achieving concurrency. The storage controller lacks the horsepower necessary to sustain performance – but that’s a topic for another day.

MLC is driving the price point of Flash towards that of enterprise high-performance spinning disk. The constant growth in the consumer space means that MLC will continue to be the most cost-effective flash technology and benefit the most from technology scaling and packaging innovations. Lower volume technologies such as eMLC and SLC do not share the same economic drivers and thus will continue to be much more expensive. The ability to utilize MLC efficiently and adapt the technology to meet the performance and access needs of Big Data will be hugely advantageous to customers and the vendors who can deliver intelligent, cost-effective solutions that utilize MLC – such as the GridIron TurboCharger™!

PCIe Flash – Part 1

One of the side-benefits of being around for a few decades is the joy of reminiscing about old technology and foibles of the past with friends from said era.

I ran into an old friend I have not seen in over ten years – one thing led to another and we were on the third round of Guinness and somehow the talk veered to the exciting world of flash memory.

And flash trends. Like…
…why a segment of the trade-press have fallen so much in love with PCI-e attached flash memory over the last few years. Pause to consider this for a moment of why PCI-e attached flash is considered the next best thing in computer architecture since Apple…

A. It is PCI-e attached – therefore, it is blindingly fast. Since, everybody knows, being outside the server is “slow”
B. It is on PCI-e – and NOT SATA (shudder – how plebian!). Therefore, it’s not cheap and common. Since everybody KNOWS SATA is slow.

Let’s look at the  two types of PCI-e SSD cards:

  • Single-stage PCI-e SSD: Cards with a PCI-e attached controller directly attached to flash chips
  • Dual-stage PCI-e SSD: Cards with a SAS HBA controller attached to multiple sub-systems – each with a traditional SSD controller attached to flash chips

You can find equally happy users for each type. You can also find users that are blissfully unaware that they have a dual-stage PCI SSD as opposed to single-stage.

Hey – so what if almost 10% of that premium unleaded you are buying @ $5/Gallon for your BMW is essentially industrial corn-hooch (a few cents a gallon in its native form) – it feels like the Ultimate Driving Machine – no?

Single-stage PCI-e SSD

This genre of products essentially started with Fusion-IO’s products.  These types of cards have a controller that attaches to PCI-e on one side and directly to flash devices on the other side.

Take a look (http://www.fusionio.com/platforms/iodrive/)  - 

It has become a true workhorse during its existence.

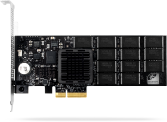
Another one (this one from Micron)

Again – the same lineup. PCI-e connects to controller that connects to Flash.

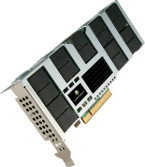
The next one here is from Virident – (http://www.virident.com/products/flashmax/)

This card not only has a very impressive list of specifications – it looks pretty stylish, too.

Here are some pros and cons of single-stage PCI-e SSDs:

Pros

Cons

Simplistic Controller Design - Most of the compute and data complexity can be left to the CPU. This is an advantage to the vendor and not necessarily to the end user Server RAM based buffering – These cards use server (host) memory and host CPU cycles to do wear-leveling and as page and data buffers.  The vendor argument here is that the host typically has enough RAM and CPU cycles and typically nobody misses them!
Wide parallel stripe - The controller can operate over much wider channels of flash chips Flash Chip changes force controller spin - As you go from one gen to another – it requires a different controller

Dual-stage PCI-e SSD

This type of PCI-e SSDs usually use a SAS Controller as first stage and then hang multiple SSD subsystems from that SAS/SATA controller. The SSD subsystem functionally looks like bare SATA SSD. That’s the second stage.

LSI SAS controllers are very popular as first stage. They have been around a long time, have great driver support and have mature interfaces up to x8 PCI-Gen2.

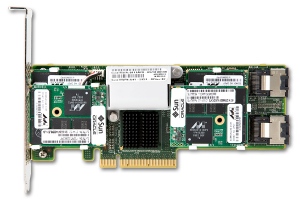
What about the second stage controller? Marvel and Sandforce are the two top popular choices. Check out the nifty Sun/Oracle F20 PCI-e Card. This card has a lot of working experience in Oracle environments. The Marvel controllers are visible on the SSD subsystems.

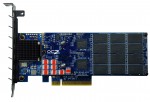
Here is another example from the good folks of OCZ -

This is a well-executed design with four SSD modules.

Below are some advantages of dual-stage designs:

  1. Good DMA and RAID Performance – For users that want to run RAID1 inside ONE single card the first stage controllers provide proven performance. Also, the typical SAS Controllers used in this stage have long and evolved history.
  2. Parallel Operation in Second Stage - The SSD controllers in the second stage operate only smaller numbers of chips at a time and work in parallel.
  3. Better scaling – Larger number of SSD modules can be attached in the second stage, potentially providing scalable performance for large capacity modules.

Coming soon -

The myths, the stats and fables of PCI-e Flash… does it really matter if you have a single or dual-stage card?